RSAM Section User's Guide
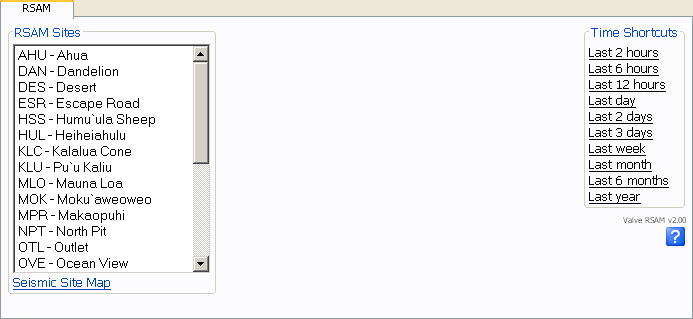
The main RSAM UI looks something like this (depending on your Valve installation):

The interface is extremely simple. Simply select a station (control-click/shift-click for multiple stations, one plot is produced for each station) and a time interval and press submit. Valve is not calculating RSAM on-the-fly, it is being imported from another process, most likely an earthworm process. For more information about RSAM see:
Thomas L. Murray and Elliot T. Endo, A Real-Time Seismic-Amplitude Measurement System (RSAM) IN: Ewert and Swanson, (eds.), 1992, Monitoring Volcanoes: Techniques and Strategies Used by the Staff of the Cascades Volcano Observatory, 1980-1990: USGS Bulletin 1966, p.5-10.
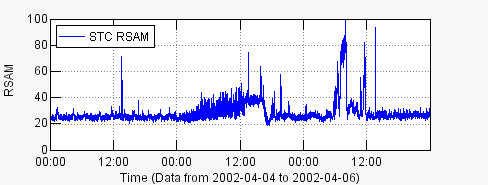
Here is an example RSAM plot:

