Strain Section User's Guide
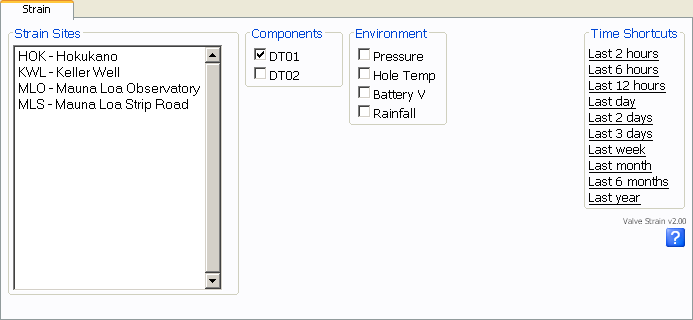
The main Strain UI looks something like this (depending somewhat on your Valve installation):

The interface is extremely simple. Simply select a station (control-click/shift-click for multiple stations, one plot is produced for each station), components, and a time interval and press submit. Available components are the strain components, DT01 and DT02, and environmental components, ambient air pressure, borehole temperature, data logger battery voltage, and rainfall (cumulative over selected time interval).
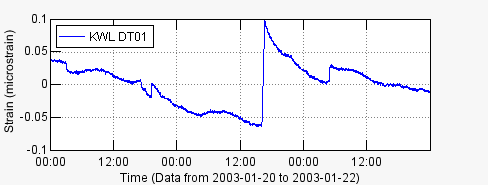
Here is an example strain plot:

