Waveform Section User's Guide
The main Waveform UI looks something like this (depending on your Valve installation):
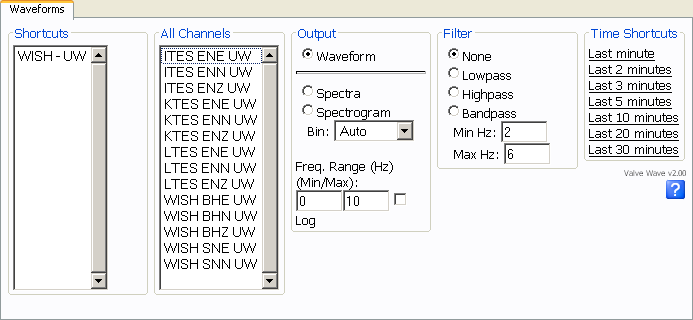
There are two ways of picking seismometer components, either through the shortcuts on the left side of the tab, or directly from the list of all components (to the right of the shortcuts). Once you have selected one or more components select an output type (if you want other than waveform) and a filter if desired.
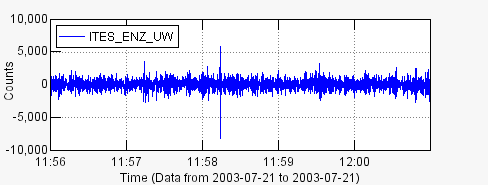
The first output type is the raw waveform:
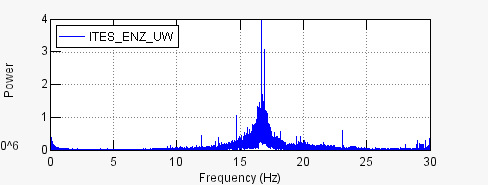
This next two involve looking at the strength of particular frequencies. The two ways to do this are with Spectra plots and Spectrogram plots. The first is a graph with power on the y-axis and frequency on the x-axis, here is an example:
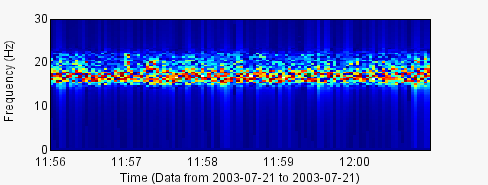
The last plot is the spectrogram which shows the power of the frequency as a color. The y-axis is the frequency band and the x-axis is time. Here is an example:
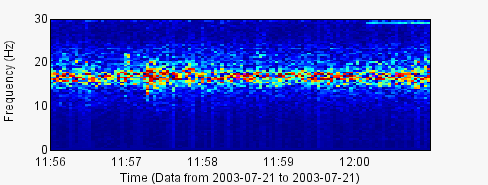
Using the frequency range controls in the Output section of the tab allow you to look at certain frequency ranges specifically, essentially they allow you to control the size of the frequency axis. Checking the log button takes the log of the power before plotting.
Lastly, you can apply a lowpass, highpass, or bandpass filter to the data before it is plotted. The filter is an 4th order Butterworth filter. A lowpass filter will eliminate all frequencies above the Max Hz setting, a highpass filter eliminates frequencies between the Min Hz setting, and a bandpass filter eliminates all frequencies outside the Min Hz-Max Hz range. Note that when you specify a filter an extra few samples are requested prior to the time you actually request to help reduce any visual filter response. Here is an example of the previous spectrogram with a bandpass filter between 15-22 Hz:
