Tilt Section User's Guide
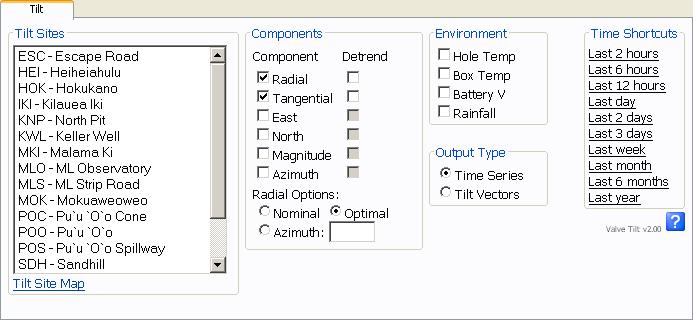
The main Tilt UI looks something like this (depending somewhat on your Valve installation):

There are two types of output from the tilt module: time-series and tilt vectors. Select the type of output desired from the Output Type radio buttons.
Time-Series
When plotting a time-series the Tilt Sites section is used to select which stations will have graphs produced (one graph per station). Use control-click and shift-click to select more than one station. A time-series will have one line for each component or environment option selected. The available components are:
- Radial: tilt radial to an azimuth. See below.
- Tangential: tilt tangential to an azimuth. See below.
- North: north tilt.
- East: east tilt.
- Magnitude: magnitude of tilt.
- Azimuth: azimuth of tilt in degrees.
Note: clicking the detrend box will remove the linear trend from the component before plotting.
If either of the radial or tangential components is selected then an azimuth must be specified in one of three ways:
- Nominal: the nominal azimuth to the assumed source of inflation or deflation. This number is stored outside of Valve.
- Optimal: the azimuth is optimized to place the maximum tilt in the radial direction.
- Azimuth: user-specified azimuth: 0..360.
Environmental components available are, if applicable:
- Hole temp: borehole temperature.
- Box temp: data logger temperature.
- Battery V: data logger battery voltage.
- Rainfall: rainfall at site, cumulative over time interval.
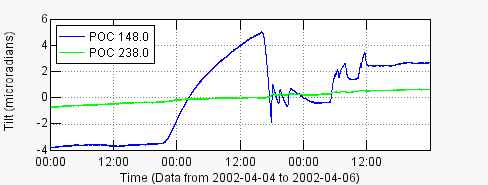
Here is an example tilt time-series:

The numbers in the legend of the plot show the azimuth of the tilt.
Tilt Vectors
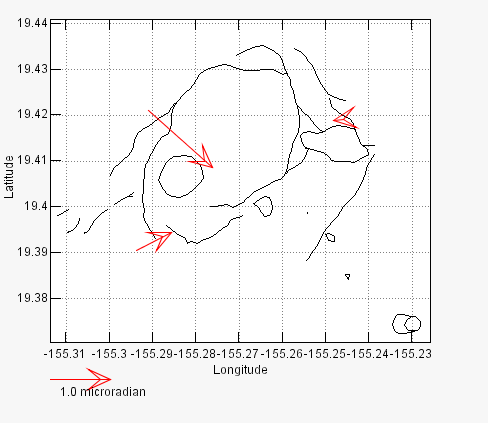
Plotting Tilt Vectors shows a spatial plot with representations of the direction of tilt at the specified Tilt Sites (control-click/shift-click to specify multiple sites) over the specified time interval.
Here is an example tilt vector plot:

Dry Tilt
Dry Tilt works exactly like Tilt except that you are allowed to select 'All data', there is no nominal azimuth, and there are no environment options. Otherwise it is same, you can generate either time-series or vector plots.
