 Interacting with Graphs
[Note - currently this text is simply a copy of what is in home.]
Most graphs that Valve produces allow extensive interaction. These graphs can be used to select time intervals on other graphs, select map bounding boxes, earthquake cross-sections. In general, a time-series graph will look something like the figure below (a time-series of a tilt event).

To select a subset of the time represented on the x-axis in this graph simply move the mouse over the graph (a red line and crosshair cursor will appear) and click the time the start and end times respectively. A green marker arrow will appear over the start time you selected and a red arrow over the end time. Or to set the time interval to exactly what is on the x-axis, click the clock icon on the graph menu bar. Of course, graphs that don't have time as the x-axis (like a frequency power chart) will not allow this. This functionality allows the user to quickly look at interesting time intervals on a variety of different instruments or to find interesting events and plot them in other, perhaps more insightful, ways. For example, a user could plot earthquake counts over a region for the last 25 years, select a time interval that has a swarm, then plot the swarm's hypocenters on an earthquake map.
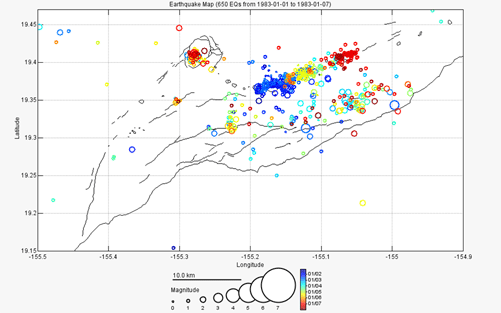
Valve also produces many spatial plots. These plots can be interacted with to select area boundaries, assuming that the tab currently visible is 'interested' in boundary selection. A spatial graph will look something like the figure below (a hypocenter plot of a dike intrusion).

If the Valve UI was open to a tab that was interested in spatial boundaries or other user-selected spatial information, clicking on the spatial graph would provide that input. In the case of selecting a boundary for an earthquake plot, for example, simply click on the upper-left corner of the new boundary (a rubber-band type box will appear), then click on the lower-right. Unfortunately, due to browsers interpreting a dragged mouse as a drag-and-drop event, dragging (the intuitive way of selecting a space) the clicked mouse will not work.
Raw Data
If you selected raw data output in the common panel a link will be provided in the title bar of the graph to that raw data. To save the data to your computer, right-click on the link and select "Save link as..." or the equivalent in whatever browser you are using.
PostScript
If you selected PostScript output in the common panel a link will be provided in the title bar of the graph to a PostScript file. This file can be loaded into programs like Adobe Illustrator in order to produce publication quality plots. To save the file to your computer, right-click on the link and select "Save link as..." or the equivalent in whatever browser you are using.
